Business Objective
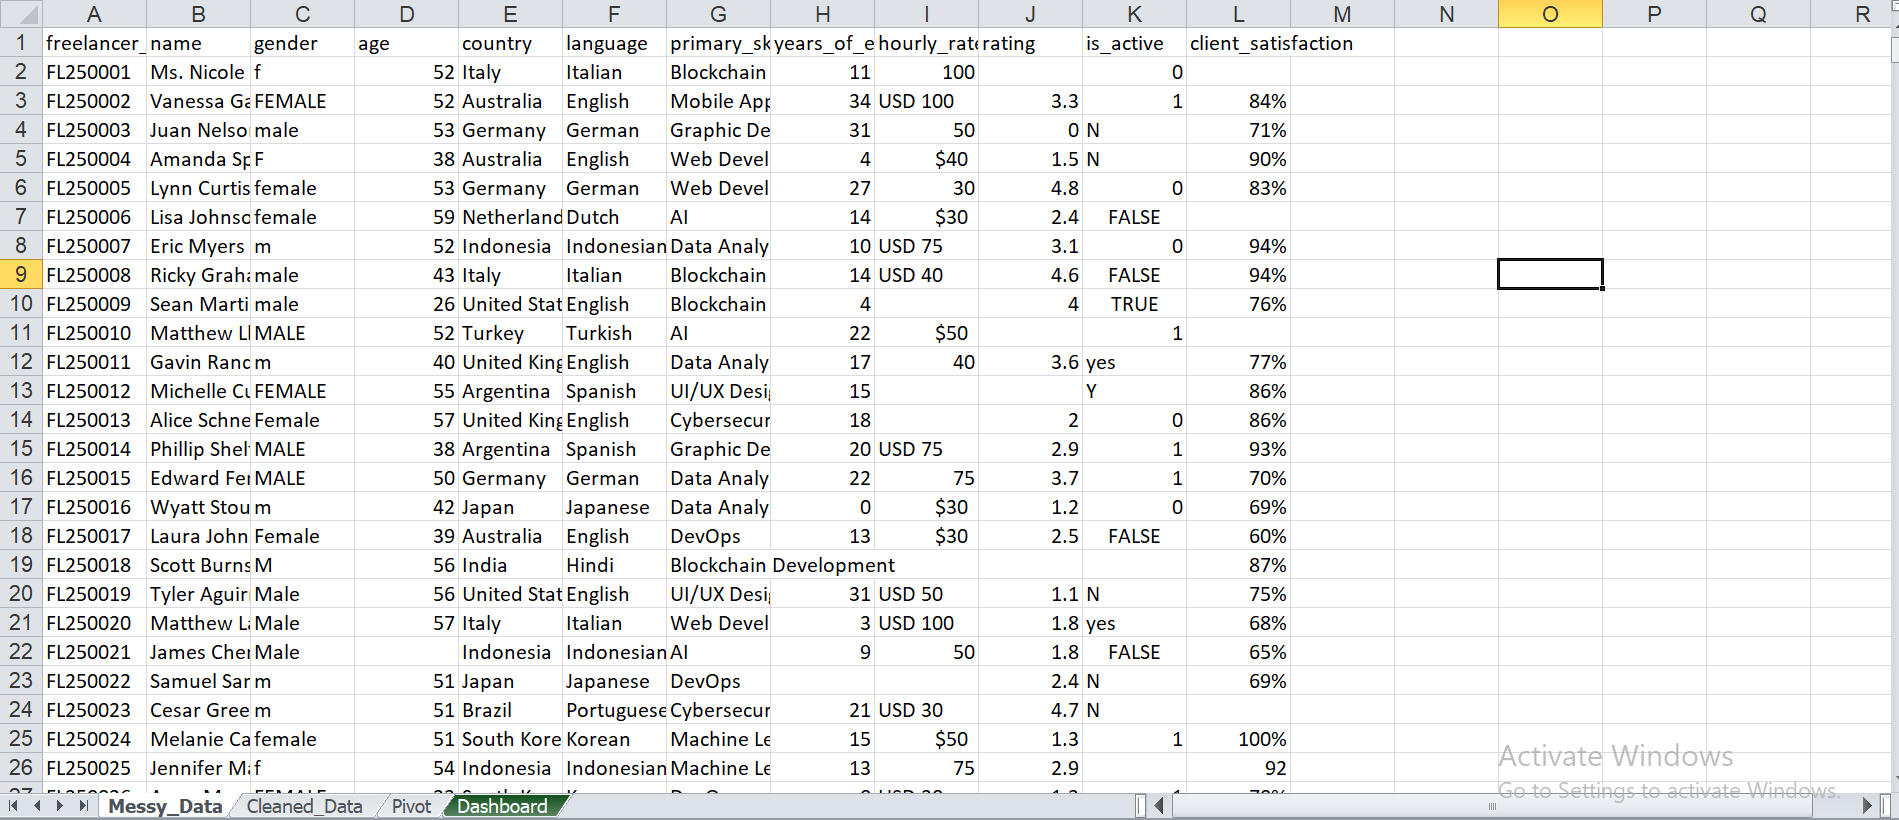
The goal was to clean and analyze a messy freelancer dataset containing inconsistent, incomplete, and duplicate records. The final output needed to provide a clear dashboard of freelancer demographics, skills, performance, and demand trends to support decision-making.
Problem Statement
The dataset included missing values, duplicates, inconsistent formatting, and unstandardized categorical fields. The challenge was to transform the raw data into a structured and reliable format for accurate analysis and visualization.
Solution Approach
Data Cleaning
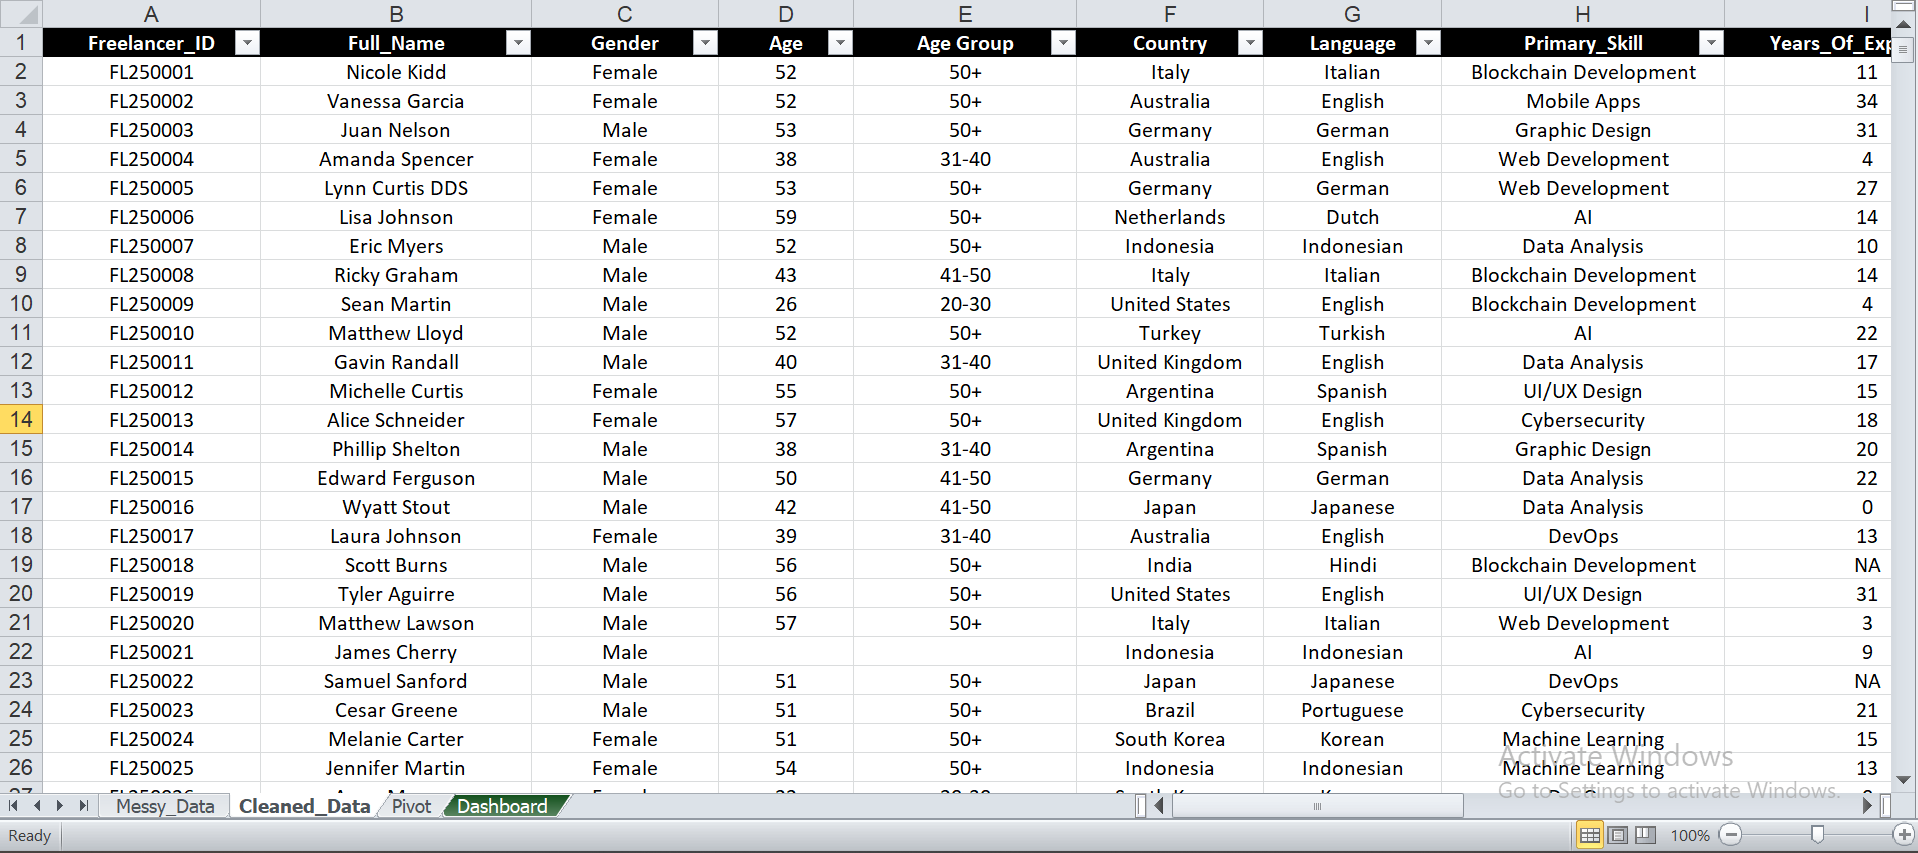
Removed missing values, duplicates, and fixed inconsistencies in categorical and numerical fields. Transformed columns such as country, gender, and status.
Data Structuring
Organized cleaned data into a structured format ready for analysis.
Visualization
Created Pivot Tables and charts to explore workforce distribution by skills, geography, experience, and satisfaction levels.
Dashboard
Developed an Excel dashboard showcasing freelancer demographics, skills demand, and performance metrics in an interactive and easy-to-read format.
Dashboard Features
Skill Distribution
Analyzed how freelancer skills are spread across different categories.
Geography Insights
Visualized freelancer availability across countries and regions.
Experience Levels
Charts showing freelancer experience bands and their hourly rates.
Performance Metrics
Dashboard included satisfaction scores and ratings for evaluating quality.
Business Insights
Preprocessed Data
Transformed raw freelancer data into a clean, reliable dataset, removing inconsistencies and improving accuracy for reporting.
Skill Demand
Identified high-demand skills across regions, supporting better hiring and project allocation strategies.
Geography Patterns
Highlighted regions with strong freelancer supply, guiding resource planning and recruitment focus.
Performance Trends
Revealed how freelancer ratings and satisfaction scores correlated with experience and hourly rates.