Business Objective
A company owns multiple hotel chains across various cities of India. The Managing director / CEO of the company wants to incorporate ‘Business and Data Intelligence’ to identify and track the source of revenue for the hotels.Hence, it is decided to develop a KPI Dashboard, using May-22 to July-22 data, which can help track its revenue sources and other relevant KPIs across various dimensions. It’ll help the management take strategic business decisions based on the insights generated from the dashboard.
Problem Statement
Identify the data sources pertaining to revenue management. Clean and model the data as per requirement for analysis. Create a revenue dashboard that measures important KPIs. Relevant filters need to provided to slice and dice the data. The dashboard should depict both high level and granular insights.
Solution Approach
Data Cleaning / Preprocessing
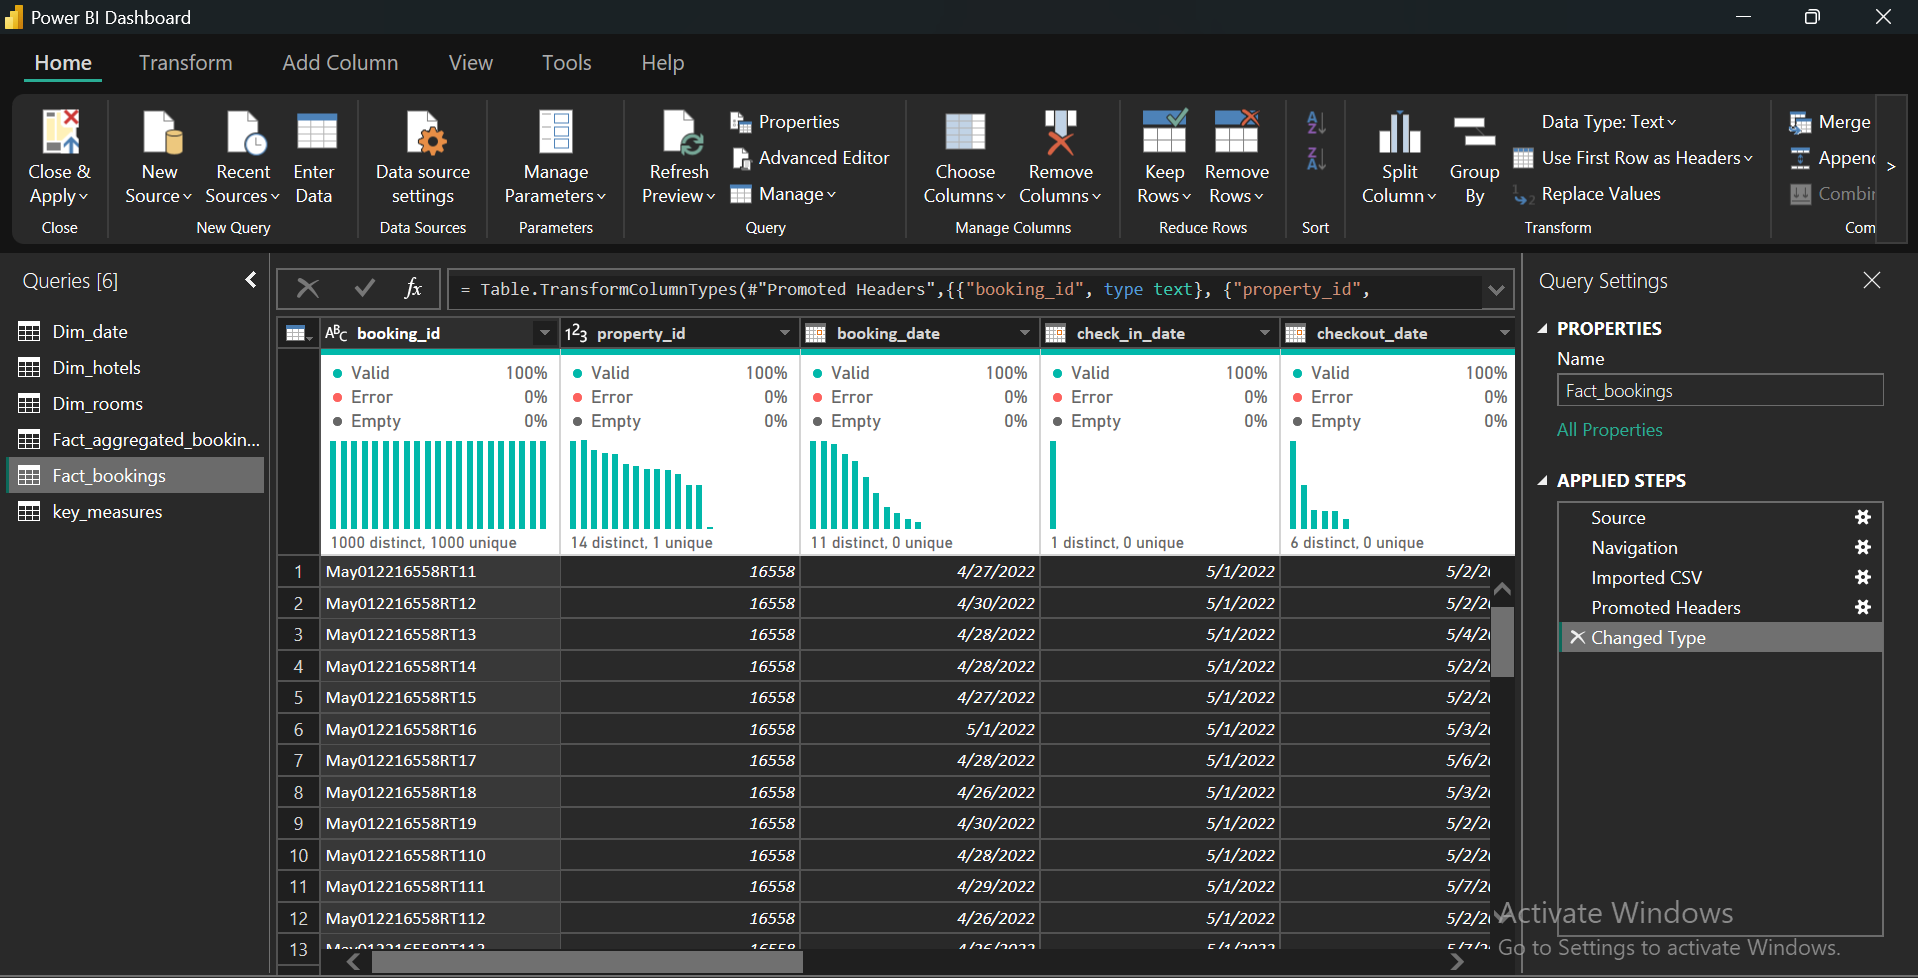
Performed cleaning in Power Query: removed nulls, fixed date formats, standardized city and hotel names, and ensured schema consistency across sources. This prepared the dataset for accurate modeling.
Data Modeling
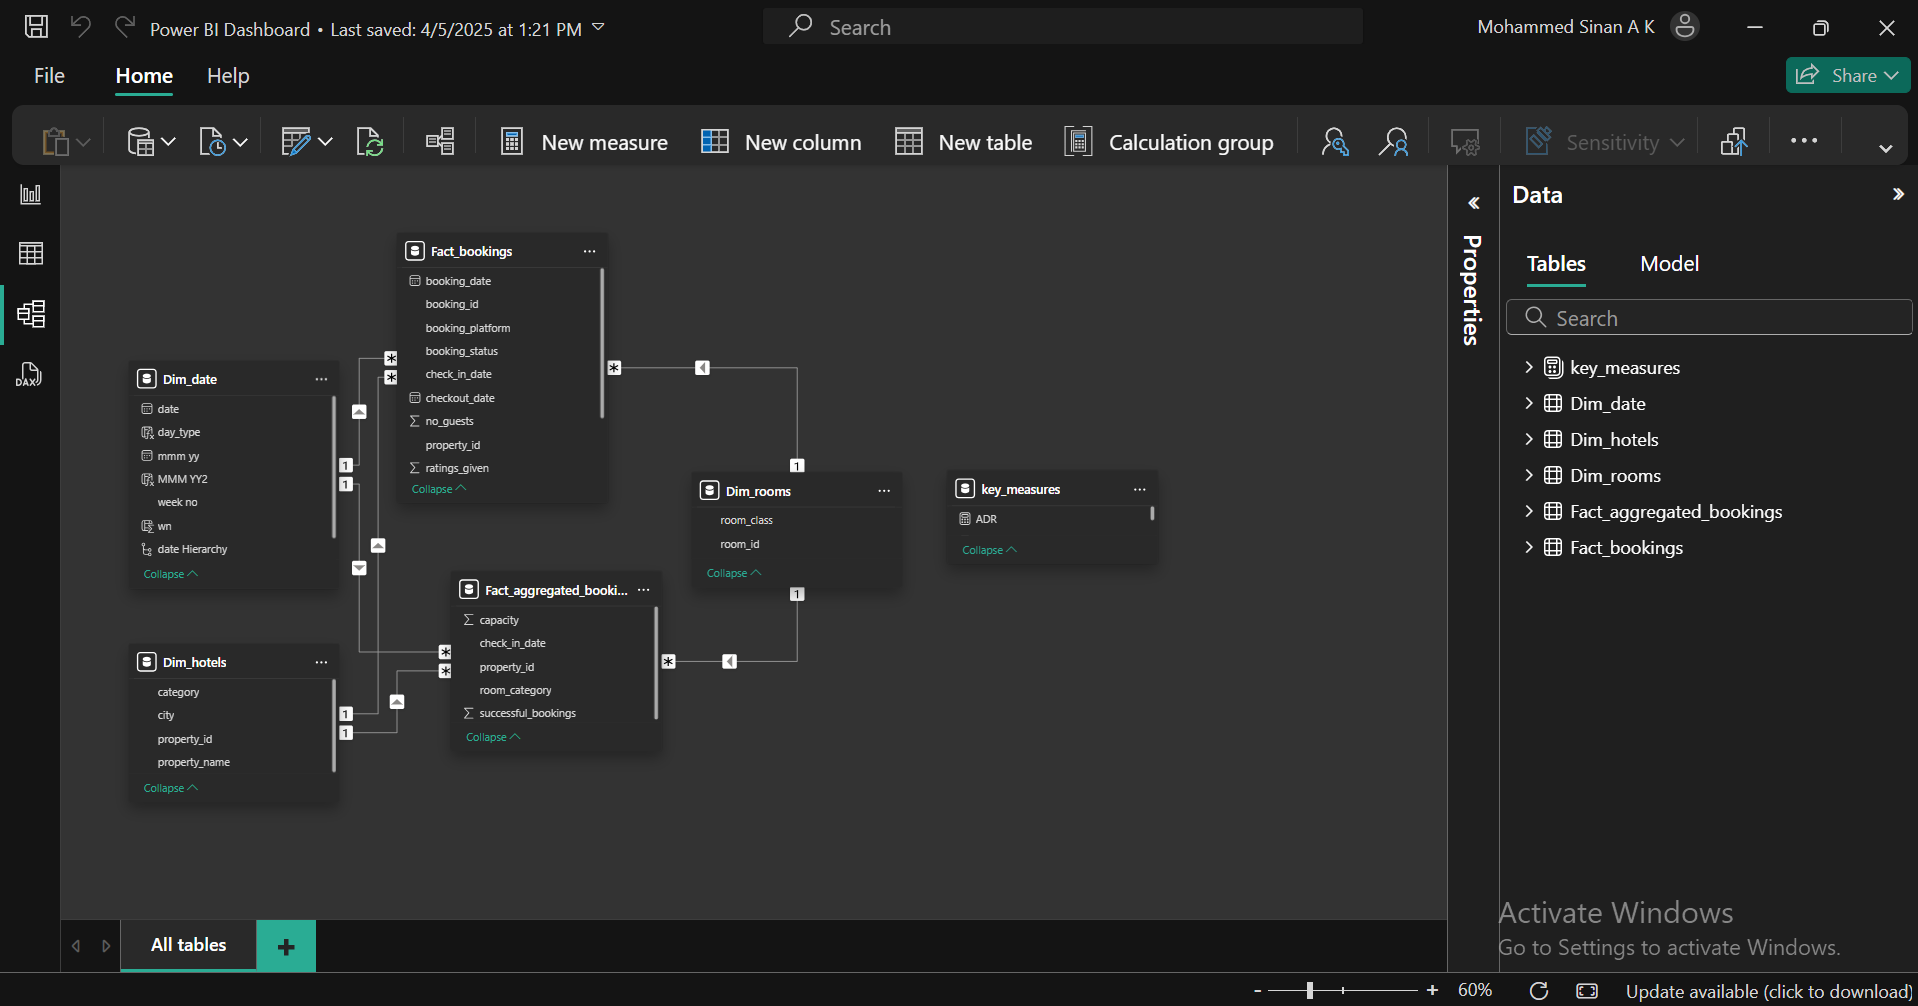
Used 3 dimension tables (Date, Hotels, Rooms) and 2 fact tables (Bookings, Aggregated Bookings) in Power BI. Established relationships with appropriate keys to enable cross-filtering across slicers.
Custom DAX Measures
Created KPIs like ADR, REVPAR, Occupancy %, DURN, DSRN, and Realisation % using DAX for actionable insights. These formulas powered all visuals and summary metrics in the dashboard.
Dashboard Features
Revenue by Room Category
Donut chart showing room-wise revenue contribution.
Trends by Metrics
Line charts tracking weekly RevPAR, ADR, and Occupancy %.
Platform Analysis
Cluster chart comparing ADR & Realisation % across platforms.
Property Metrics Table
Detailed table view of metrics by city and property ID.
Business Insights
City Revenue Distribution
Mumbai generated the highest revenue, while Delhi contributed the least during May–July 2022. Strategic focus is needed to increase revenue from the Delhi region.
ADR Pricing Strategy
The ADR trend line remained flat across weeks, indicating lack of dynamic pricing. Introducing variable rates based on weekday/weekend or demand seasons could significantly boost average revenue per room.
Low-Performing Properties
Hotel in Bangalore and in Mumbai reported the lowest occupancy %, lowest average ratings, and highest cancellation rates. These locations need urgent attention on hospitality experience and guest satisfaction.
Customer-Centric Improvements
Improving service quality and customer experience in low-performing hotels is likely to result in more positive reviews and higher retention.
Commission-Free Bookings
Introducing discount coupons on the official website or private channels can drive direct bookings and eliminate commission fees from third-party platforms.
Delhi Occupancy Anomaly
Delhi maintained 60%+ occupancy across all months yet delivered the lowest revenue. Understanding this anomaly can help replicate occupancy strategies elsewhere while improving pricing and upsells in Delhi itself.
Power BI Report
Conclusion
Developed a DAX-powered BI solution tracking occupancy, ADR, and RevPAR across 5 cities. Diagnosed flat ADR trends and proposed dynamic pricing, projected to boost bookings by 12%. Visualized week-on-week revenue and occupancy trends, increasing strategic visibility by 40%. Added custom tooltips and slicers to drive user-centric interactions and executive insights.